Solana (SOL) Price: Descending Triangle Apex Signals Imminent 10% Breakout
Key Takeaways
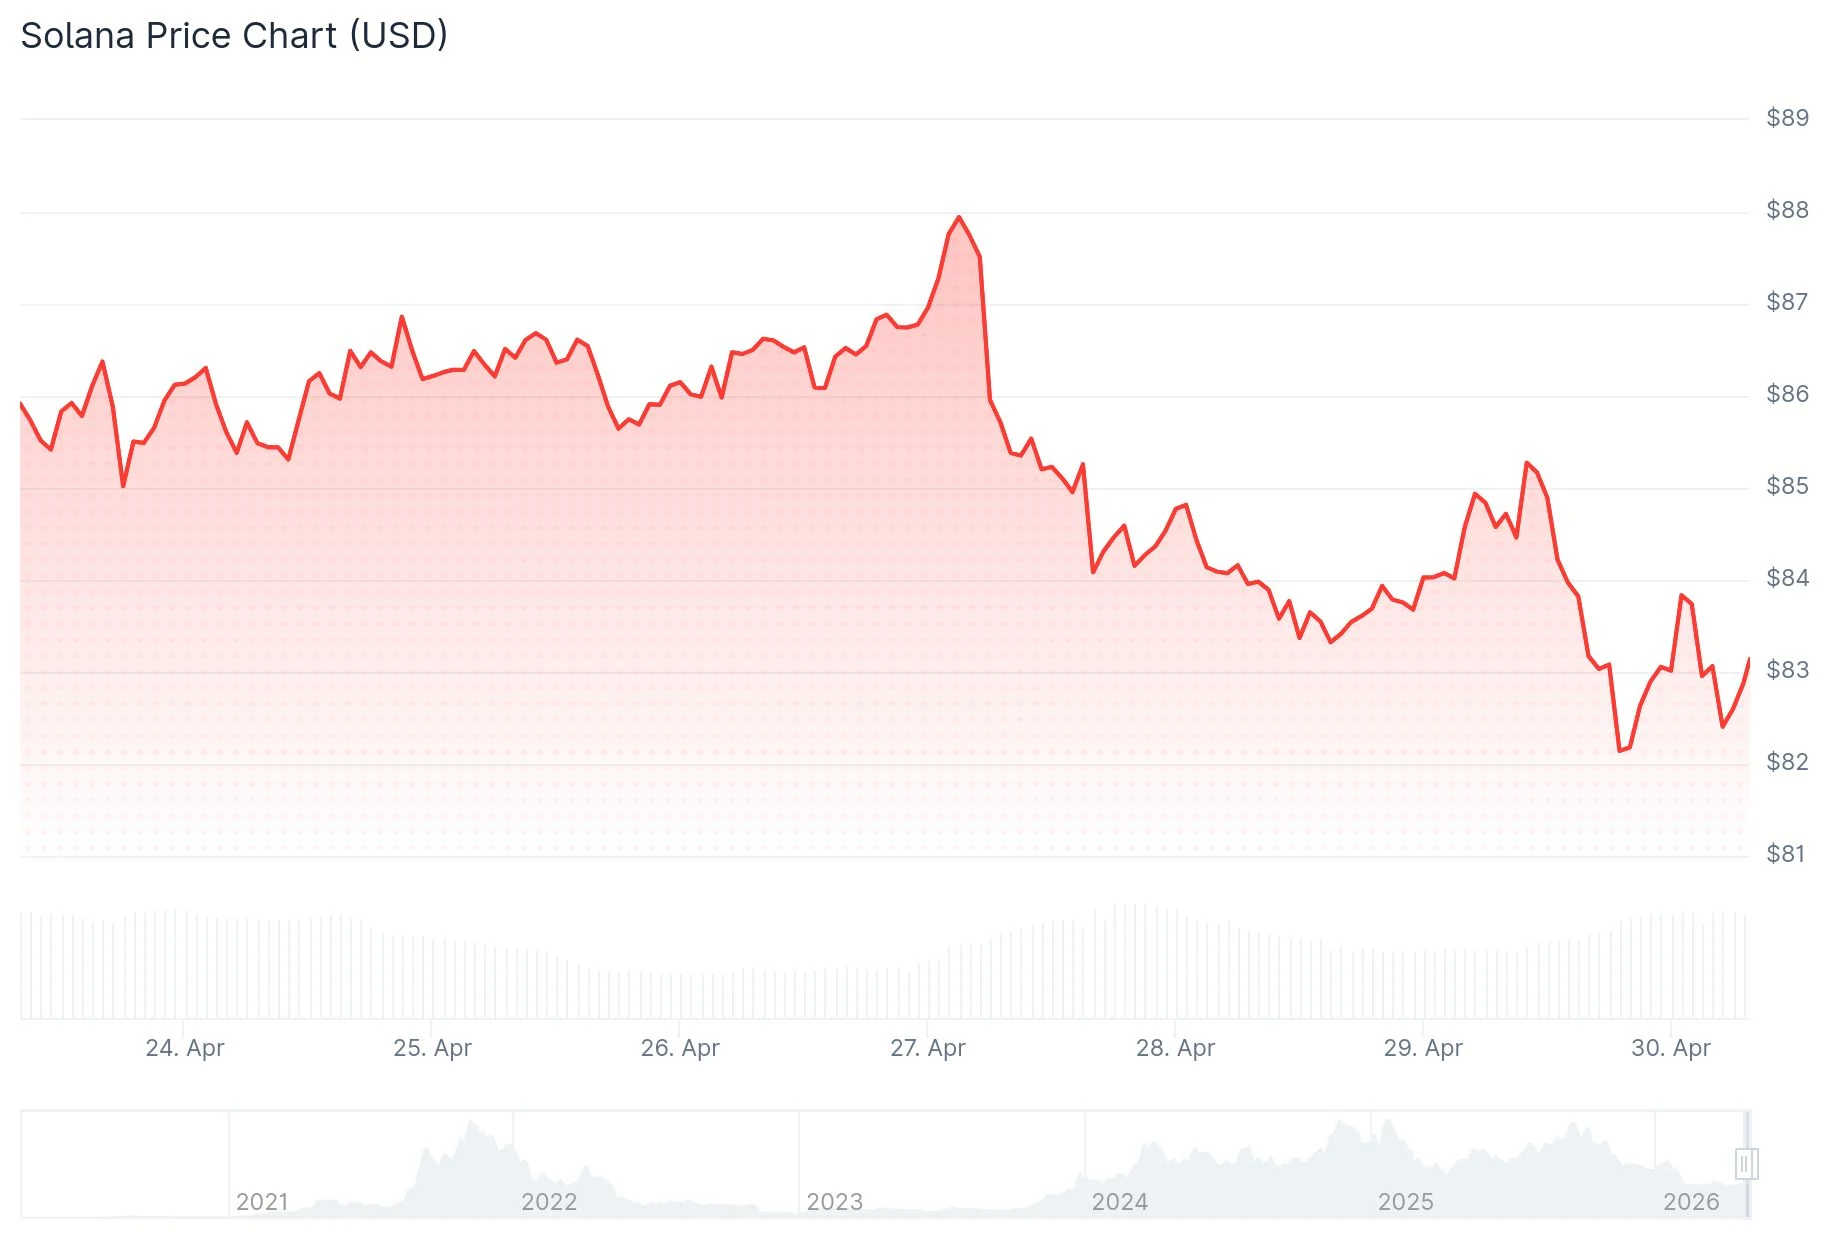
- SOL is currently trading at $84.63, confined within a compressed CRT band stretching from $84.43 to $85.05.
- Technical analyst Ali Charts identified a descending triangle formation reaching its apex, with a potential 10% swing targeting either $93 or $76.
- The $86–$88 resistance zone continues to reject upward attempts, with SOL unable to break through on several occasions.
- Solana’s development teams confirmed that Falcon quantum-resistant signature technology is ready for deployment without affecting network efficiency.
- Weak ETF inflows and diminishing social engagement suggest further sideways price action may continue.
Solana finds itself at a critical juncture. After days of tightening price action, technical indicators suggest an explosive move is brewing — though the direction remains uncertain.
 Solana (SOL) Price
As of April 29, SOL is valued at $84.63. The asset remains trapped within a constrained trading corridor, with the session’s upper limit at $85.05 and lower boundary at $84.43. The SAR support level rests at $84.27, while the 20-day exponential moving average sits marginally below at $84.24, creating a concentrated support zone.
The 50-day, 100-day, and 200-day EMAs are clustered within a remarkably tight 1.2-point span directly above the current valuation. Such technical compression historically precedes rapid price movements once directional momentum emerges.
Technical Pattern Analysis
Crypto analyst Ali Charts highlighted this week that SOL has reached the convergence point of a descending triangle pattern on shorter timeframes. The pattern’s upper trendline has been declining from the $92 level, while the lower support boundary has been ascending from the April 18 bottom near $82. Price action has been systematically narrowing between these converging lines.
When triangles reach their apex, they typically exhaust their consolidation range and break decisively in one direction. Ali Charts calculated the pattern’s measured move at approximately 10%, establishing upside targets near $93 or downside objectives around $76. The current CRT configuration favors bullish resolution, with the SAR indicator and EMA confluence providing immediate support.
The $86–$88 resistance band continues to function as a formidable barrier. SOL has encountered repeated rejections at this level, while both the RSI and MACD indicators display subdued momentum readings. A decisive daily close above $85.05 would represent the initial confirmation needed to challenge that resistance structure once again.
A more concerning scenario involves the broader channel support. Should the $80 threshold fail, technical observers anticipate accelerated selling pressure toward the mid-$70s range. The most probable near-term outcome remains continued lateral movement between $81 and $87 as the pattern reaches maximum compression.
Quantum-Resistant Infrastructure Deployment Ready
Beyond price dynamics, the Solana Foundation released a comprehensive quantum readiness assessment this week. Both Anza and Firedancer — the two organizations maintaining Solana’s core protocol infrastructure — have successfully integrated test implementations of Falcon, the NIST-approved post-quantum cryptographic signature algorithm that Algorand already operates in live production environments.
The Falcon protocol can be activated rapidly should quantum computing threats escalate, without requiring disruptive network upgrades or performance compromises. The technical implementation maintains Solana’s characteristic high-speed transaction processing and network capacity.
This announcement follows two significant security developments in April. The Drift protocol experienced a $280 million security breach attributed to a sophisticated six-month operation linked to North Korean threat actors. Additionally, the Solana Foundation introduced STRIDE, a comprehensive security assessment initiative providing continuous threat intelligence to DeFi protocols managing over $10 million in locked value.
Regarding derivatives markets, futures trading volume contracted 16.39% to $7.45 billion while open interest remained stable at $5.02 billion. The long-to-short positioning ratio stands at 1.0076, with leading traders on both Binance and OKX maintaining long bias above 2.64.
Throughout the previous 24-hour period, long positions faced $3.70 million in forced liquidations compared to $1.38 million for short positions. Current open interest of $5.09 billion remains substantially below the late 2025 peak approaching $16 billion.
The post Solana (SOL) Price: Descending Triangle Apex Signals Imminent 10% Breakout appeared first on Blockonomi.


You May Also Like

White House Blocks Anthropic’s Plan to Expand Access to Its Mythos AI Model

WLFI Token Unlock Advances with 99.5% Support